

Are you creating growth or just paying for it?

Find the easier path to a bigger basket

See the cost of being out and the cost of holding on

Is it lifting baskets or just paying for shipping?

Put a number on the orders you never took

Know how much cash your slowest stock is holding

Find the products you could charge more for

Count how many first orders turn into a second
Know what your inbox takes off every order
Products your customers keep writing in about
Track what comes back and what it costs to take it
What you can control and minimize
Slow orders cost twice. Once in support, once in returns
Every ticket matched to the order and product behind it
The cost of closing tickets and retaining customers
Find the share of orders that need a human
Find the products that cost more than they earn
Your biggest seller and your best earner are rarely the same
One size or colour can drag a whole range down
The items that sell well and come straight back
The products that only move when they're on sale
Know how your last releases actually landed
Find out how much of your range never sells
The pairs your customers already make without a prompt

Every analysis has the same goal: turn messy ecommerce data into something you can act on.

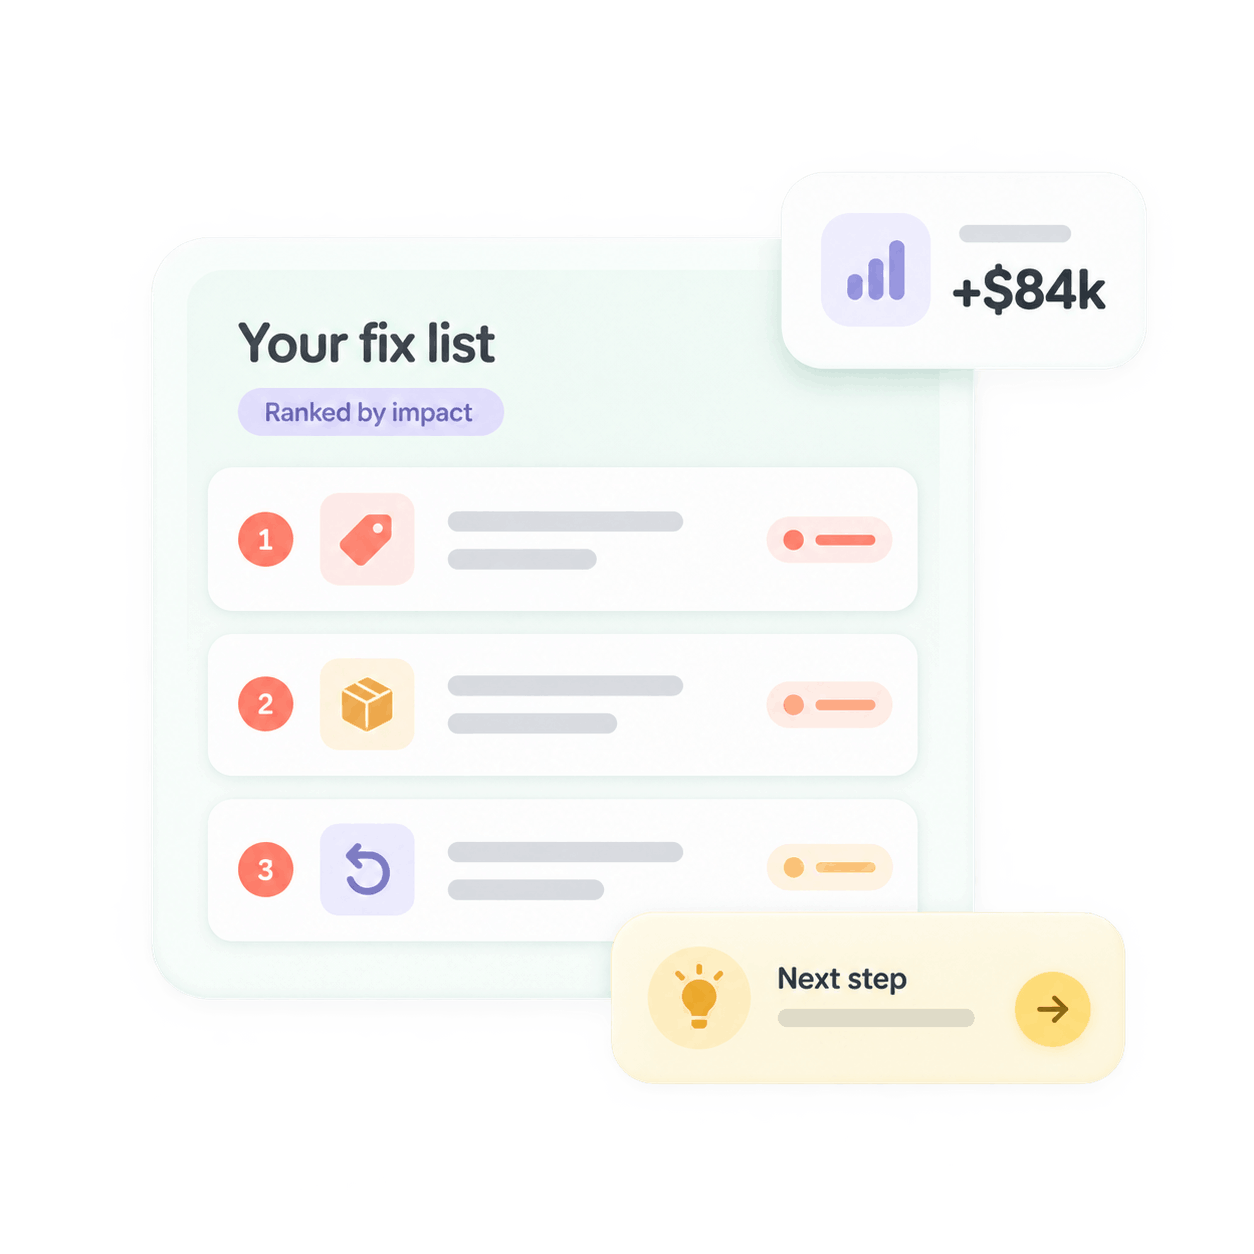
Move your free-shipping threshold. 14% of orders land just below it.
Restock your #3 bestseller. It was out of stock for 23 days last quarter.
Fix the size guides on your jackets. They drive a third of your returns.
Reprice your retro sunglasses. They only run at 11% margin.
Example items for illustration. Your fix list is built from your store's own data.
You connect through a secure, read-only API. We can't change a price, edit a product or touch an order . We only read the data your report is built from. Disconnect any time.